文章详情页
html5 - echarts折线图 markline 数值怎么设置 不想用默认的average
浏览:49日期:2023-02-01 11:26:29
问题描述
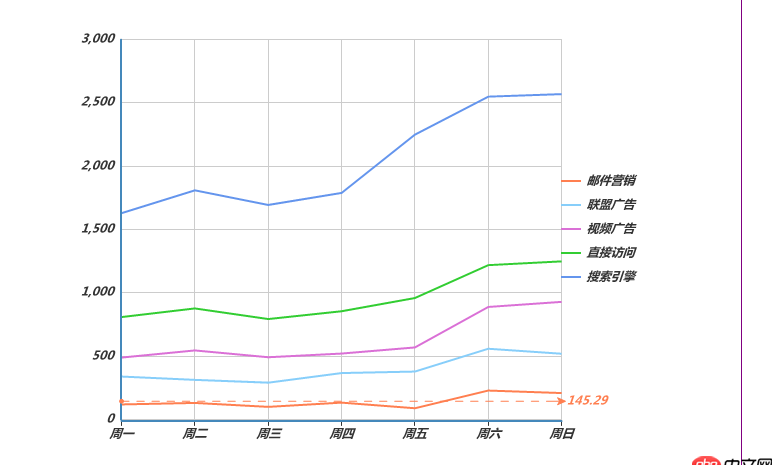 如图所示的 145.29 这条线怎么设置//代码如下series: [{
name: ’邮件营销’,type: ’line’,stack: ’总量’,symbol: ’none’,markLine: { data: [{type: ’average’,name: ’平均值’ }]},label:{ normal:{show:true,position:’top’,formatter:’{c}%’ }},itemStyle : { normal: {label : {show: true}}},data: [120, 132, 101, 134, 90, 230, 210] }]
问题解答
回答1:方法一: markLine: { data:[[ {name:’两点之间的线’,coord:[0,120] },{coord:[6, 500] }] ]}, 方法二: markLine: { data:[[ {name: ’两个屏幕坐标之间的标线’,x: 100,y: 100 }, {x: 500,y: 200 }] ]},
注:coord:[x,y],其中x是Xaxis值的下标值,y是Yaxis的值;参考api
标签:
Html5
相关文章:
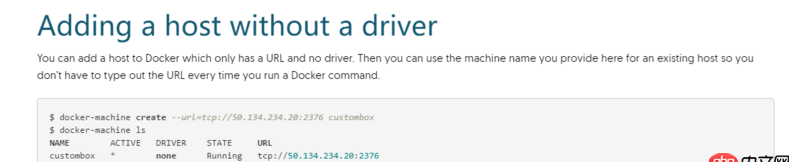
1. docker-machine添加一个已有的docker主机问题2. dockerfile - 我用docker build的时候出现下边问题 麻烦帮我看一下3. angular.js - angularjs的自定义过滤器如何给文字加颜色?4. java编程思想第4版中文版的几处谬误?5. 请问怎么改变超链接字体的颜色?6. docker内创建jenkins访问另一个容器下的服务器问题7. java - 做数据库向手机端的推送要系统地学习哪些知识?求大神指点,谢谢!8. 关docker hub上有些镜像的tag被标记““This image has vulnerabilities””9. python - 内容审核(图片鉴别)回调无数据?10. python - django queryset自定义排序问题
排行榜
 网公网安备
网公网安备