Python图像处理二值化方法实例汇总
在用python进行图像处理时,二值化是非常重要的一步,现总结了自己遇到过的6种 图像二值化的方法(当然这个绝对不是全部的二值化方法,若发现新的方法会继续新增)。
1. opencv 简单阈值 cv2.threshold
2. opencv 自适应阈值 cv2.adaptiveThreshold (自适应阈值中计算阈值的方法有两种:mean_c 和 guassian_c ,可以尝试用下哪种效果好)
3. Otsu’s 二值化
例子:
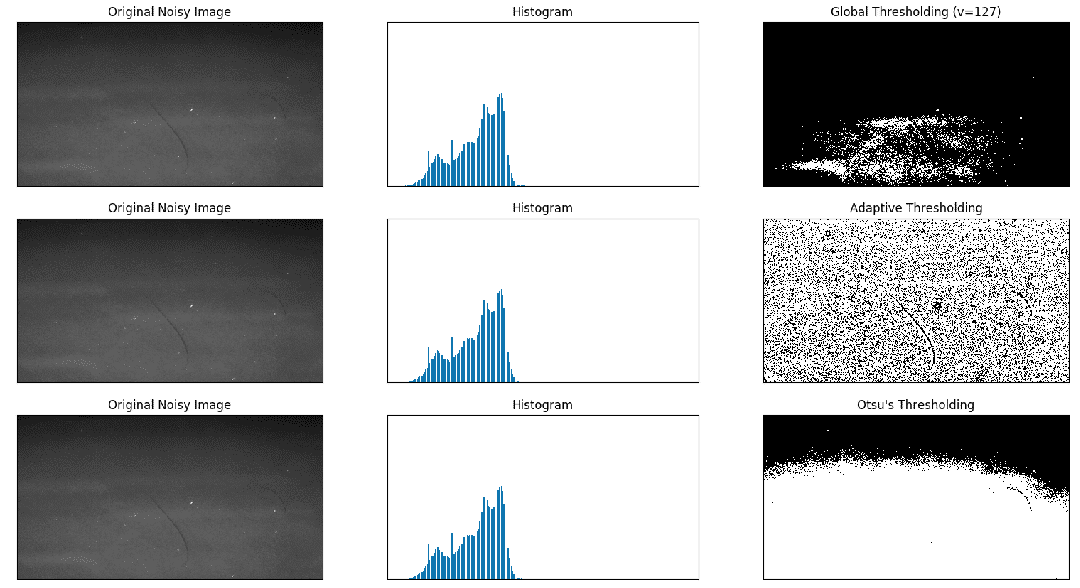
import cv2import numpy as npfrom matplotlib import pyplot as pltimg = cv2.imread(’scratch.png’, 0)# global thresholdingret1, th1 = cv2.threshold(img, 127, 255, cv2.THRESH_BINARY)# Otsu’s thresholdingth2 = cv2.adaptiveThreshold(img, 255, cv2.ADAPTIVE_THRESH_MEAN_C, cv2.THRESH_BINARY, 11, 2)# Otsu’s thresholding# 阈值一定要设为 0 !ret3, th3 = cv2.threshold(img, 0, 255, cv2.THRESH_BINARY + cv2.THRESH_OTSU)# plot all the images and their histogramsimages = [img, 0, th1, img, 0, th2, img, 0, th3]titles = [ ’Original Noisy Image’, ’Histogram’, ’Global Thresholding (v=127)’, ’Original Noisy Image’, ’Histogram’, 'Adaptive Thresholding', ’Original Noisy Image’, ’Histogram’, 'Otsu’s Thresholding']# 这里使用了 pyplot 中画直方图的方法, plt.hist, 要注意的是它的参数是一维数组# 所以这里使用了( numpy ) ravel 方法,将多维数组转换成一维,也可以使用 flatten 方法# ndarray.flat 1-D iterator over an array.# ndarray.flatten 1-D array copy of the elements of an array in row-major order.for i in range(3): plt.subplot(3, 3, i * 3 + 1), plt.imshow(images[i * 3], ’gray’) plt.title(titles[i * 3]), plt.xticks([]), plt.yticks([]) plt.subplot(3, 3, i * 3 + 2), plt.hist(images[i * 3].ravel(), 256) plt.title(titles[i * 3 + 1]), plt.xticks([]), plt.yticks([]) plt.subplot(3, 3, i * 3 + 3), plt.imshow(images[i * 3 + 2], ’gray’) plt.title(titles[i * 3 + 2]), plt.xticks([]), plt.yticks([])plt.show()
结果图:
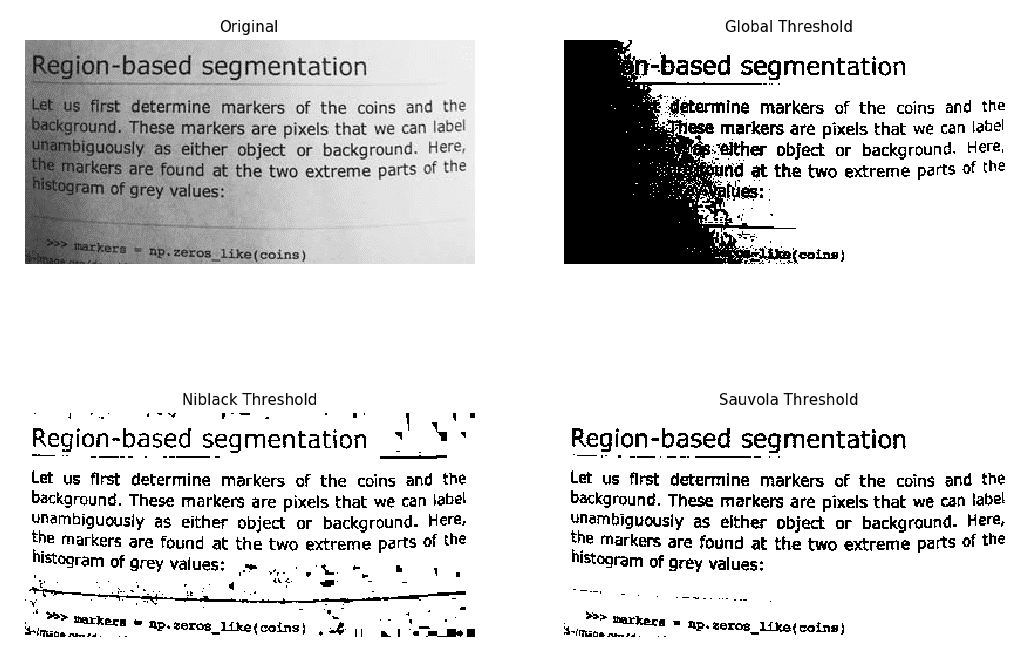
4. skimage niblack阈值
5. skimage sauvola阈值 (主要用于文本检测)
例子:
https://scikit-image.org/docs/dev/auto_examples/segmentation/plot_niblack_sauvola.html
import matplotlibimport matplotlib.pyplot as pltfrom skimage.data import pagefrom skimage.filters import (threshold_otsu, threshold_niblack, threshold_sauvola)matplotlib.rcParams[’font.size’] = 9image = page()binary_global = image > threshold_otsu(image)window_size = 25thresh_niblack = threshold_niblack(image, window_size=window_size, k=0.8)thresh_sauvola = threshold_sauvola(image, window_size=window_size)binary_niblack = image > thresh_niblackbinary_sauvola = image > thresh_sauvolaplt.figure(figsize=(8, 7))plt.subplot(2, 2, 1)plt.imshow(image, cmap=plt.cm.gray)plt.title(’Original’)plt.axis(’off’)plt.subplot(2, 2, 2)plt.title(’Global Threshold’)plt.imshow(binary_global, cmap=plt.cm.gray)plt.axis(’off’)plt.subplot(2, 2, 3)plt.imshow(binary_niblack, cmap=plt.cm.gray)plt.title(’Niblack Threshold’)plt.axis(’off’)plt.subplot(2, 2, 4)plt.imshow(binary_sauvola, cmap=plt.cm.gray)plt.title(’Sauvola Threshold’)plt.axis(’off’)plt.show()
结果图:
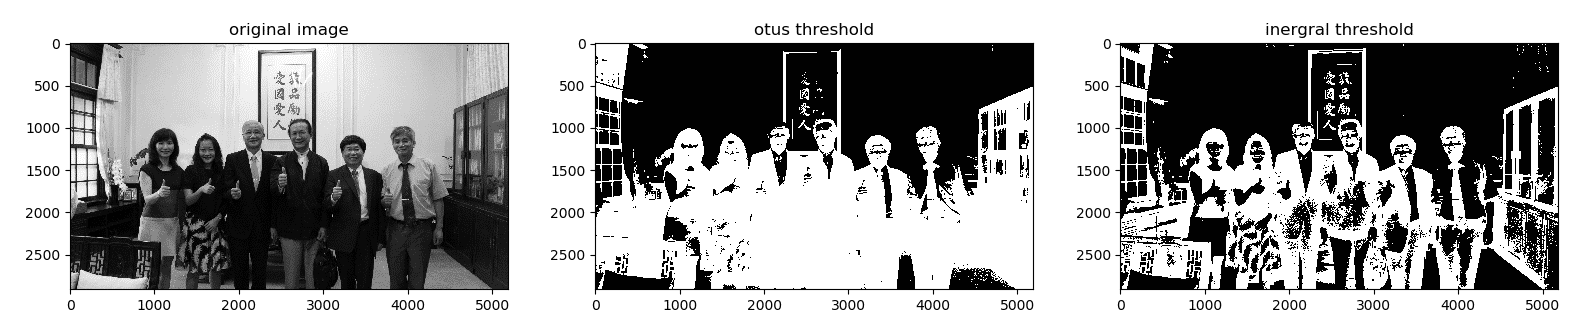
6.IntegralThreshold(主要用于文本检测)
使用方法: 运行下面网址的util.py文件
https://github.com/Liang-yc/IntegralThreshold
结果图:
以上就是本文的全部内容,希望对大家的学习有所帮助,也希望大家多多支持好吧啦网。
相关文章:

 网公网安备
网公网安备