Python matplotlib画图时图例说明(legend)放到图像外侧详解
用python的matplotlib画图时,往往需要加图例说明。如果不设置任何参数,默认是加到图像的内侧的最佳位置。
import matplotlib.pyplot as pltimport numpy as np x = np.arange(10) fig = plt.figure()ax = plt.subplot(111) for i in xrange(5): ax.plot(x, i * x, label=’$y = %ix$’ % i) plt.legend() plt.show()
这样的结果如图所示:

如果需要将该legend移到图像外侧,有多种方法,这里介绍一种。
在plt.legend()函数中加入若干参数:
plt.legend(bbox_to_anchor=(num1, num2), loc=num3, borderaxespad=num4)
bbox_to_anchor(num1,num2)表示legend的位置和图像的位置关系,num1表示水平位置,num2表示垂直位置。num1=0表示legend位于图像的左侧垂直线(这里的其它参数设置:num2=0,num3=3,num4=0)。
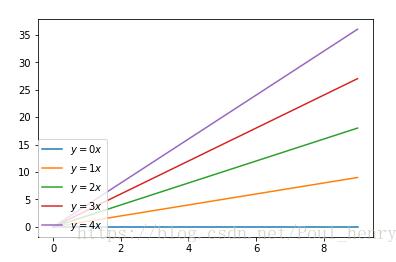
num1=1表示legend位于图像的右侧垂直线(其它参数设置:num2=0,num3=3,num4=0)。

为了美观,需要将legend放于图像的外侧,而又距离不是太大,一般设num1=1.05。
num2=0表示legend位于图像下侧水平线(其它参数设置:num1=1.05,num3=3,num4=0)。
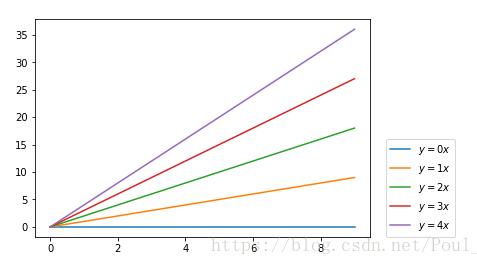
num2=1表示legend位于图像上侧水平线(其它参数设置:num1=1.05,num3=3,num4=0)。
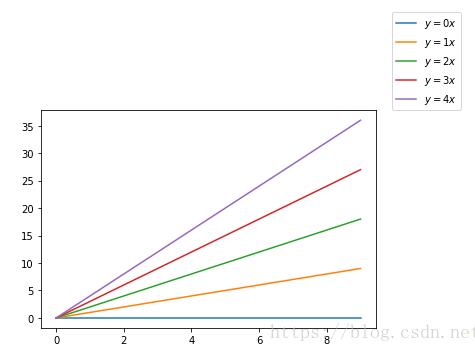
所以,如果希望legend位于图像的右下,需要将num2设为0,位于图像的右上,需要将num2设为1。
由于legend是一个方框,bbox_to_anchor=(num1, num2)相当于表示一个点,那么legend的哪个位置位于这个点上呢。参数num3就用以表示哪个位置位于该点。
loc参数对应 Location String Location Code ’best’ 0 ’upper right’ 1 ’upper left’ 2 ’lower left’ 3 ’lower right’ 4 ’right’ 5 ’center left’ 6 ’center right’ 7 ’lower center’ 8 ’upper center’ 9 ’center’ 10所以,当设bbox_to_anchor=(1.05,0),即legend放于图像右下角时,为美观起见,需要将legend的左下角,即’lower left’放置该点,对应该表的‘Location Code’数字为3,即参数num3置为3或直接设为‘lower left’;而当设bbox_to_anchor=(1.05,1),即legend放于图像右上角时,为美观起见,需要将legend的左上角,即’upper left’放置该点,对应该表的‘Location Code’数字为2,即参数num3置为2或直接设为‘upper left’。
根据参考网址上的解释,参数num4表示轴和legend之间的填充,以字体大小距离测量,默认值为None,但实际操作中,如果不加该参数,效果是有一定的填充,下面有例图展示,我这里设为0,即取消填充,具体看个人选择。
这是将legend放于图像右下的完整代码:
import matplotlib.pyplot as pltimport numpy as np x = np.arange(10) fig = plt.figure()ax = plt.subplot(111) for i in xrange(5): ax.plot(x, i * x, label=’$y = %ix$’ % i) plt.legend(bbox_to_anchor=(1.05, 0), loc=3, borderaxespad=0) plt.show()
效果展示:
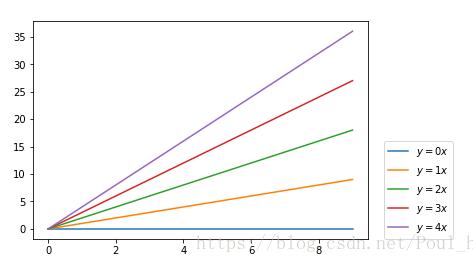
这里legend的‘lower left’置于(1.05, 0)的位置。
如果不加入参数num4,那么效果为:

legend稍靠上,有一定的填充。
这是将legend放于图像右上的完整代码:
import matplotlib.pyplot as pltimport numpy as np x = np.arange(10) fig = plt.figure()ax = plt.subplot(111) for i in xrange(5): ax.plot(x, i * x, label=’$y = %ix$’ % i) plt.legend(bbox_to_anchor=(1.05, 1), loc=2, borderaxespad=0) plt.show()
效果展示:
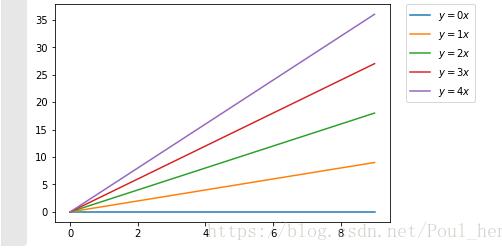
这里legend的‘upper left’置于(1.05, 0)的位置。
如果不加入参数num4,那么效果为:
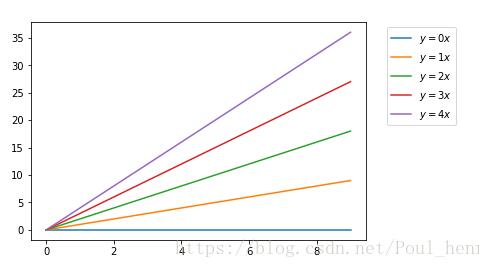
legend稍靠下。
以上这篇Python matplotlib画图时图例说明(legend)放到图像外侧详解就是小编分享给大家的全部内容了,希望能给大家一个参考,也希望大家多多支持好吧啦网。
相关文章:

 网公网安备
网公网安备