Python如何使用bokeh包和geojson数据绘制地图
最近要绘制伦敦区地图,查阅了很多资料后最终选择使用bokeh包以及伦敦区的geojson数据绘制。bokeh是基于python的绘图工具,可以绘制各种类型的图表,支持geojson数据的读取及绘制地图。
安装bokeh
$ pip install bokeh
软件版本
python-3.7.7bokeh-2.0.0
数据来源
伦敦地图数据来源于Highmaps地图数据集。下载的是英国的地图数据united-kindom.geo.json。需要对得到的数据进行预处理才能得到只含伦敦地区的数据。这需要对geojson数据的格式有一定的了解。在对数据进行处理之前,先看如何绘制英国地图。
绘制英国地图
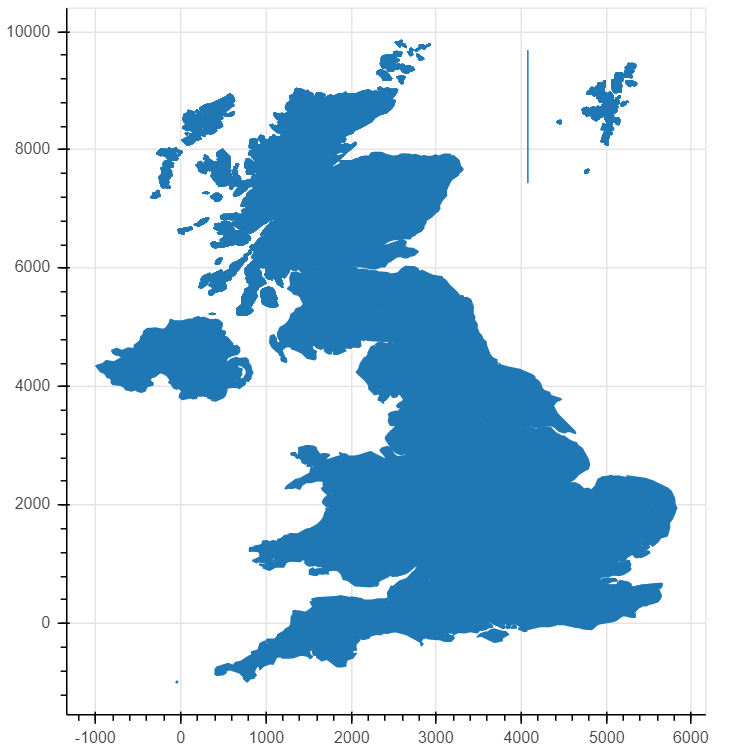
from bokeh.plotting import curdoc, figurefrom bokeh.models import GeoJSONDataSource# 读入英国地图数据并传给GeoJSONDataSourcewith open('united-kindom.geo.json', encoding='utf8') as f: geo_source = GeoJSONDataSource(geojson=f.read())# 设置一张画布p = figure(width=500, height=500)# 使用patches函数以及geo_source绘制地图p.patches(xs=’xs’, ys=’ys’, source=geo_source)curdoc().add_root(p)
上述代码可以绘制出英国地图。将上述代码保存为test.py,在终端运行
$ bokeh serve --show test.py
这会自动打开浏览器,并显示英国地图。运行结果如图:
获取伦敦地区数据
获取伦敦地区数据可以手动从united-kingdom.geo.json文件中筛选出伦敦的数据,也可以先用python先把数据过滤一遍,然后将数据传给bokeh。这需要对geojson文件格式有一定的了解,在此不详细介绍。
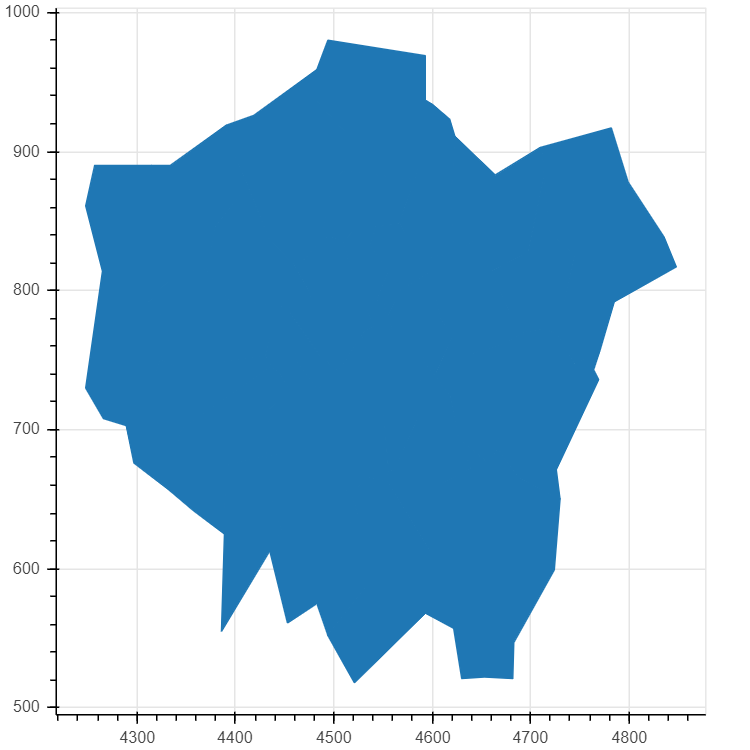
from bokeh.plotting import curdoc, figurefrom bokeh.models import GeoJSONDataSourceimport json# 用json库读取数据with open('united-kindom.geo.json', encoding='utf8') as f: data = json.loads(f.read())# 判断是不是伦敦地区数据def isInLondon(district): if ’type’ in district[’properties’] and ’london borough’ in district[’properties’][’type’].lower(): return True if ’type-en’ in district[’properties’] and ’london borough’ in district[’properties’][’type’].lower(): return True if ’woe-name’ in district[’properties’] and ’city of london’ in district[’properties’][’woe-name’].lower(): return True return False# 过滤数据data[’features’] = list(filter(isInLondon, data[’features’]))#geo_source = GeoJSONDataSource(geojson=json.dumps(data))p = figure(width=500, height=500)p.patches(xs=’xs’, ys=’ys’, source=geo_source)curdoc().add_root(p)
运行结果如图:
美化
上面的伦敦地图只是一个大概的轮廓,下面对地图添加一系列功能。
添加各区轮廓线
p.patches(xs=’xs’, ys=’ys’, fill_alpha=0.7, # 画轮廓线 line_color=’white’, # 线的颜色 line_width=0.5, # 线的宽度 source=geo_source)
现在地图区域轮廓很清晰。
添加颜色
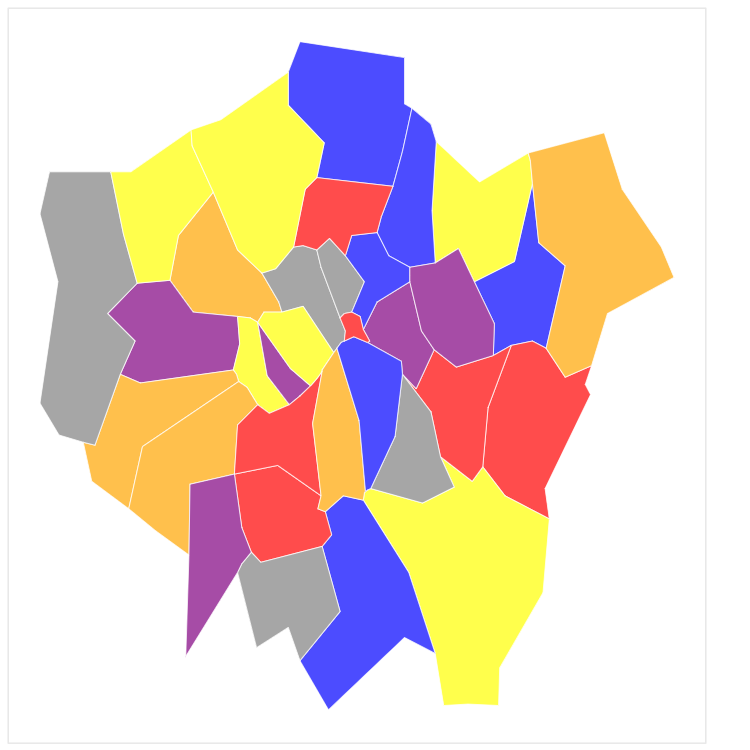
# 为每一个地区增加一个color属性for i in range(len(data[’features’])): data[’features’][i][’properties’][’color’] = [’blue’, ’red’, ’yellow’, ’orange’, ’gray’, ’purple’][i % 6]p.patches(xs=’xs’, ys=’ys’, fill_alpha=0.7, line_color=’white’, line_width=0.5, color='color', # 增加颜色属性,这里的'color'对应每个地区的color属性 source=geo_source)
现在地图五颜六色。
增加图注
import random# 随机产生数据用于展示for i in range(len(data[’features’])): data[’features’][i][’properties’][’number’] = random.randint(0, 20_000)p = figure(width=500, height=500, tooltips='@name, number: @number' # 使用tooltips生成图注,@+属性名称,这里的name是数据中原本有的,number是新近添加的。 )
现在鼠标放到区域上时,会显示'区域名, number: 数字'。
去掉坐标轴与背景线
p.axis.axis_label = Nonep.axis.visible = Falsep.grid.grid_line_color = None
最终代码
from bokeh.plotting import curdoc, figurefrom bokeh.models import GeoJSONDataSourceimport jsonimport randomwith open('united-kindom.geo.json', encoding='utf8') as f: data = json.loads(f.read())def isInLondon(district): if ’type’ in district[’properties’] and ’london borough’ in district[’properties’][’type’].lower(): return True if ’type-en’ in district[’properties’] and ’london borough’ in district[’properties’][’type’].lower(): return True if ’woe-name’ in district[’properties’] and ’city of london’ in district[’properties’][’woe-name’].lower(): return True return Falsedata[’features’] = list(filter(isInLondon, data[’features’]))for i in range(len(data[’features’])): data[’features’][i][’properties’][’color’] = [’blue’, ’red’, ’yellow’, ’orange’, ’gray’, ’purple’][i % 6] data[’features’][i][’properties’][’number’] = random.randint(0, 20_000)geo_source = GeoJSONDataSource(geojson=json.dumps(data))p = figure(width=500, height=500, tooltips='@name, number: @number')p.patches(xs=’xs’, ys=’ys’, fill_alpha=0.7, line_color=’white’, line_width=0.5, color='color', source=geo_source)p.axis.axis_label = Nonep.axis.visible = Falsep.grid.grid_line_color = Nonecurdoc().add_root(p)
伦敦地图完成了
总结
最开始想用pyecharts做的,但是pyecharts并没有伦敦的地图。折腾半天,最后只好自己找geojson数据来画地图。
找到了很多关于地图的数据和工具,比如上文中提到的highmap数据集,以及DataV.altas,这个工具可以可视化地提取中国区域的地图数据,但感觉比起自己找数据,画中国地图还是pyecharts来得实在。
数据最重要。
以上就是本文的全部内容,希望对大家的学习有所帮助,也希望大家多多支持好吧啦网。
相关文章:
 网公网安备
网公网安备