手把手带你了解Python数据分析--matplotlib
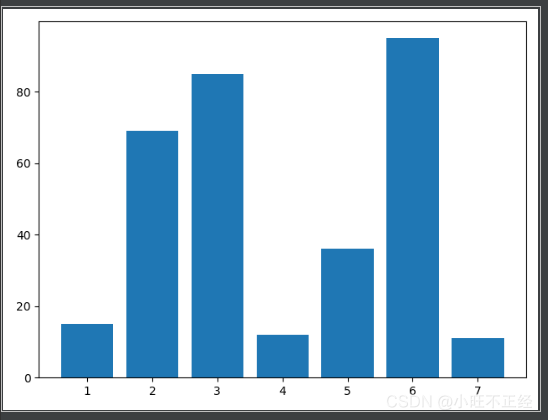
bar()函数绘制柱形图
import matplotlib.pyplot as plx = [1,2,3,4,5,6,7]y = [15,69,85,12,36,95,11]pl.bar(x,y)pl.show()
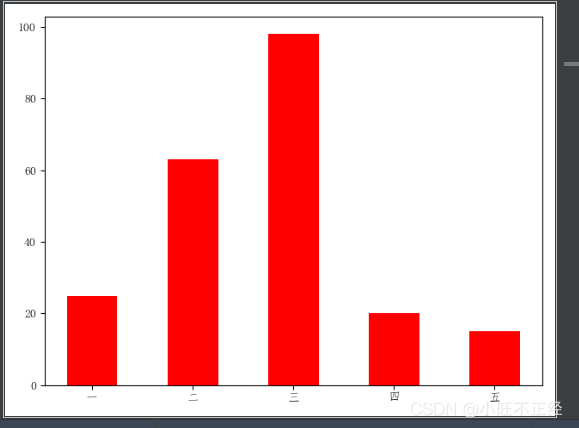
bar()函数的参数width和color设置每根柱子的宽度和颜色有中文时要添加pl.rcParams[’font.sans-serif’] = [’FangSong’]有负号时要添加pl.rcParams[’axes.unicode_minus’] = False
import matplotlib.pyplot as plpl.rcParams[’font.sans-serif’] = [’FangSong’]x = [’一’,’二’,’三’,’四’,’五’]y = [25,63,98,20,15]pl.bar(x,y,width=0.5,color=’red’)pl.show()
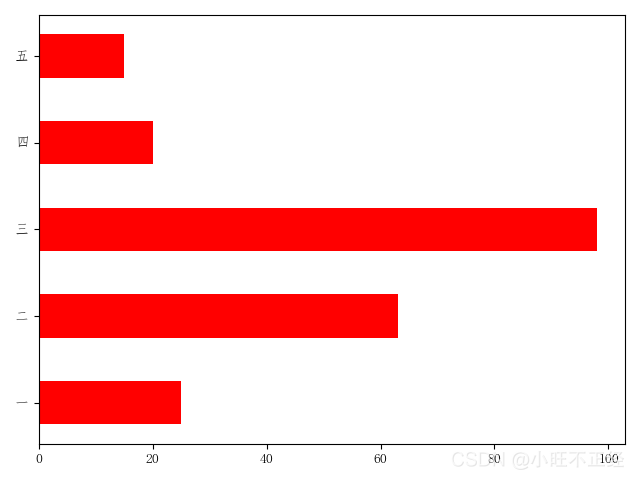
barh()函数可绘制条形图
参数height设置条形的高度
import matplotlib.pyplot as plpl.rcParams[’font.sans-serif’] = [’FangSong’]x = [’一’,’二’,’三’,’四’,’五’]y = [25,63,98,20,15]pl.barh(x,y,height=0.5,color=’red’)pl.show()
plot()函数可绘制折线图
import matplotlib.pyplot as plpl.rcParams[’font.sans-serif’] = [’FangSong’]x = [’一’,’二’,’三’,’四’,’五’]y = [25,63,98,20,15]pl.plot(x,y,linewidth=2,linestyle=’-’,color=’red’,marker=’*’,markersize=10)pl.show()
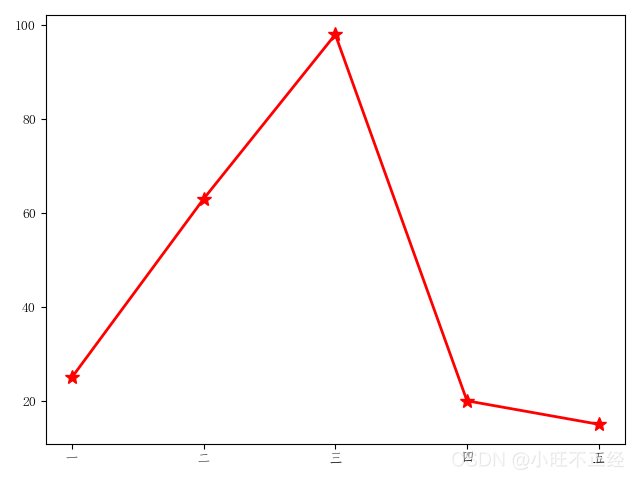
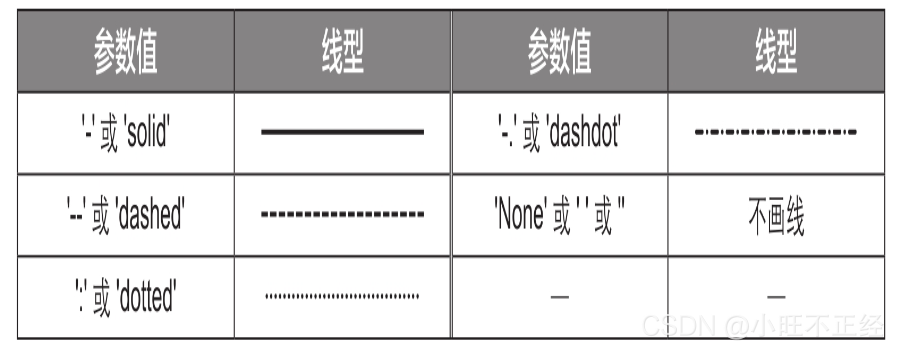
参数linewidth用于设置折线的粗细(单位为“点”)参数linestyle用于设置折线的线型
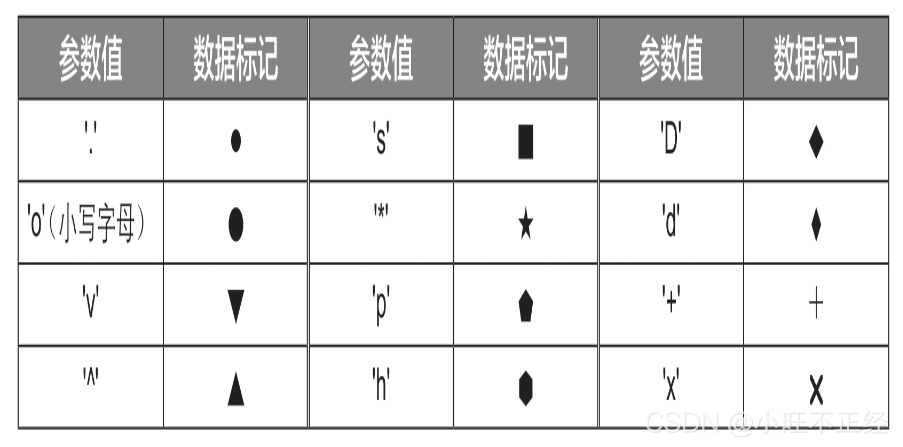
marker= ’*’表示设置数据标记的样式为五角星markersize=10表示设置数据标记的大小为10点
pie()函数可绘制饼图
import matplotlib.pyplot as plpl.rcParams[’font.sans-serif’] = [’FangSong’]x = [’一’,’二’,’三’,’四’,’五’]y = [25,63,98,20,15]pl.pie(y,labels=x,labeldistance=1,autopct=’%.2f%%’,pctdistance=1.2)pl.show()
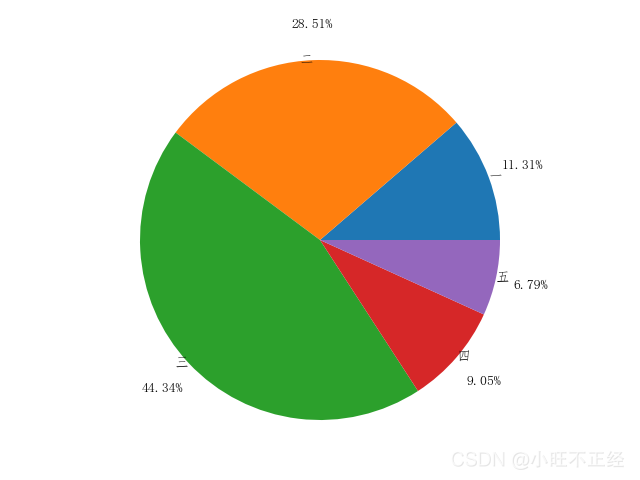
参数labels用于设置每一个饼图块的标签参数labeldistance用于设置每一个饼图块的标签与中心的距离参数autopct用于设置百分比数值的格式参数pctdistance用于设置百分比数值与中心的距离
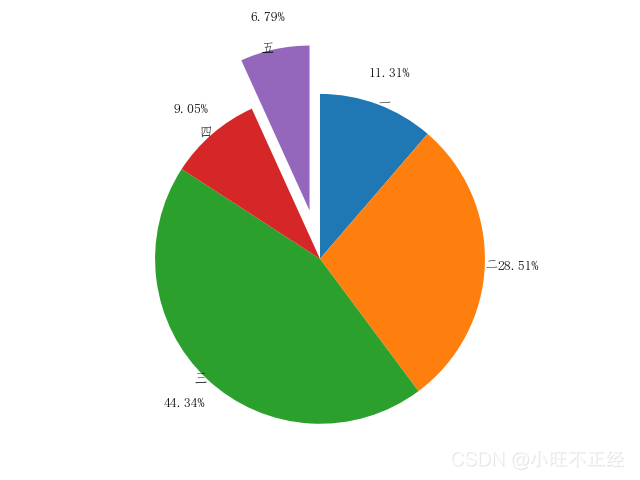
分离饼图块import matplotlib.pyplot as plpl.rcParams[’font.sans-serif’] = [’FangSong’]x = [’一’,’二’,’三’,’四’,’五’]y = [25,63,98,20,15]pl.pie(y,labels=x,labeldistance=1,autopct=’%.2f%%’,pctdistance=1.2,explode=[0,0,0,0,0.3],startangle=90,counterclock=False)pl.show()
参数explode用于设置每一个饼图块与圆心的距离,其值通常是一个列表,列表的元素个数与饼图块的数量相同。这里设置为[0, 0, 0, 0, 0, 0.3],第5个元素为0.3,其他元素均为0,表示将第5个饼图块分离。参数startangle用于设置第1个饼图块的初始角度参数counterclock用于设置各个饼图块是逆时针排列还是顺时针排列,为False时表示顺时针排列,为True时表示逆时针排列。
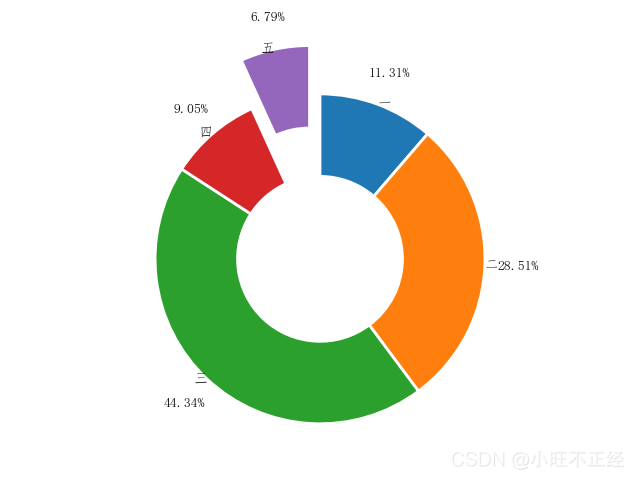
import matplotlib.pyplot as plpl.rcParams[’font.sans-serif’] = [’FangSong’]x = [’一’,’二’,’三’,’四’,’五’]y = [25,63,98,20,15]pl.pie(y,labels=x,labeldistance=1,autopct=’%.2f%%’,pctdistance=1.2,explode=[0,0,0,0,0.3],startangle=90,counterclock=False, wedgeprops={’width’:0.5,’linewidth’:2,’edgecolor’:’white’})pl.show()
wedgeprops={‘width’: 0.5, ‘linewidth’:2, ‘edgecolor’: ‘white’}表示设置饼图块的环宽(圆环的外圆半径减去内圆半径)占外圆半径的比例为0.5边框粗细为2边框颜色为白色。将饼图块的环宽占比设置为小于1的数(这里为0.3)就能绘制出圆环图
本篇文章就到这里了,希望能给你带来帮助,也希望您能够多多关注好吧啦网的更多内容!
相关文章:
 网公网安备
网公网安备