文章详情页
echarts实现3d柱状图的2种方式举例
浏览:94日期:2022-06-01 13:59:39
目录
- echarts实现3d柱状图的两种方式
- 方法1: echarts.graphic.extendShape 自定义图形
- 方式2: 象型柱图(type: “pictorialBar”)
- 总结
echarts实现3d柱状图的两种方式
看了不少关于3d柱状图的案例,发现做3d柱状图 常用的两种方式就是 自定义图形和象型柱图, 两种实现方式效果如下:
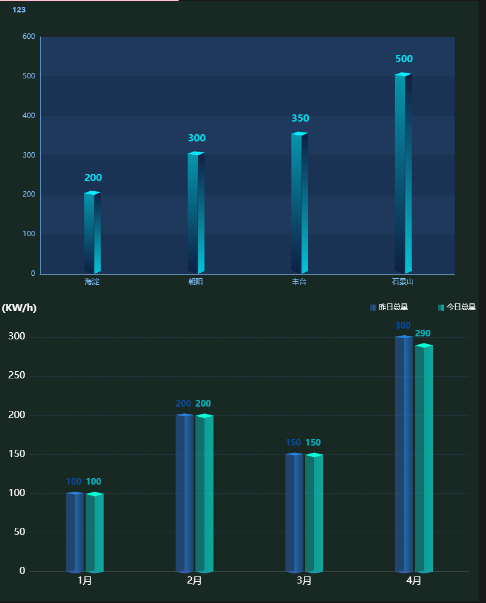
方法1: echarts.graphic.extendShape 自定义图形
echarts自定义图形的详细用法点这里, 官网点这里, 图中第一个3d柱状图我参考的案例在这里, 看了很多 echarts这种3d案例, 自定义图形做3d柱状图,貌似只能有个柱子(可能 能做双柱,但是 我真的不会)
封装成组件的完整代码如下:
<template></template><script setup lang="ts">import { nextTick, watch } from "vue";import echarts from "@/assets/ts/echarts";import useResizeChart from "@/hooks/useResizeChart";function mergeConfig(defaultConfig: object, config: object) { return Object.assign(defaultConfig, config);}function initOption(): echarts.EChartsCoreOption { // 绘制左侧面 const CubeLeft = echarts.graphic.extendShape({shape: { x: 0, y: 0,},buildPath: function (ctx, shape) { // 会canvas的应该都能看得懂,shape是从custom传入的 const xAxisPoint = shape.xAxisPoint; const c0 = [shape.x + 3.5, shape.y]; const c1 = [shape.x - 11.5, shape.y - 3]; const c2 = [xAxisPoint[0] - 11.5, xAxisPoint[1] - 6.5]; const c3 = [xAxisPoint[0] + 3.5, xAxisPoint[1]]; ctx.moveTo(c0[0], c0[1])// @ts-ignore.lineTo(c1[0], c1[1]).lineTo(c2[0], c2[1]).lineTo(c3[0], c3[1]).closePath();}, }); // 绘制右侧面 const CubeRight = echarts.graphic.extendShape({shape: { x: 0, y: 0,},buildPath: function (ctx, shape) { const xAxisPoint = shape.xAxisPoint; const c1 = [shape.x + 3, shape.y]; const c2 = [xAxisPoint[0] + 3, xAxisPoint[1]]; const c3 = [xAxisPoint[0] + 12, xAxisPoint[1] - 7]; const c4 = [shape.x + 12, shape.y - 7]; ctx.moveTo(c1[0], c1[1])// @ts-ignore.lineTo(c2[0], c2[1]).lineTo(c3[0], c3[1]).lineTo(c4[0], c4[1]).closePath();}, }); // 绘制顶面 const CubeTop = echarts.graphic.extendShape({shape: { x: 0, y: 0,},buildPath: function (ctx, shape) { const c1 = [shape.x + 3.5, shape.y]; const c2 = [shape.x + 12.5, shape.y - 7.5]; //右点 const c3 = [shape.x - 2.5, shape.y - 10]; const c4 = [shape.x - 11.5, shape.y - 3]; ctx.moveTo(c1[0], c1[1])// @ts-ignore.lineTo(c2[0], c2[1]).lineTo(c3[0], c3[1]).lineTo(c4[0], c4[1]).closePath();}, }); // 注册三个面图形 echarts.graphic.registerShape("CubeLeft", CubeLeft); echarts.graphic.registerShape("CubeRight", CubeRight); echarts.graphic.registerShape("CubeTop", CubeTop); const VALUE = props.value; const series = [{ type: "custom", renderItem: (params: any, api: any) => {let cubeLeftStyle = new echarts.graphic.LinearGradient(0, 0, 0, 1, [ {offset: 0,// @ts-ignorecolor: props.color[0], }, {offset: 1,color: "rgba(7, 20, 52,0.7)", },]);let cubeRightStyle = new echarts.graphic.LinearGradient(0, 0, 0, 1, [ {offset: 0,color: "rgba(7, 20, 52,1)", }, {offset: 1,// @ts-ignorecolor: props.color[0], },]);let cubeTopStyle = new echarts.graphic.LinearGradient(0, 0, 0, 1, [ {offset: 0,// @ts-ignorecolor: props.color[1] || props.color[0], },]);const location = api.coord([api.value(0), api.value(1)]);return { type: "group", children: [{ type: "CubeLeft", shape: {api,xValue: api.value(0),yValue: api.value(1),x: location[0],y: location[1],xAxisPoint: api.coord([api.value(0), 0]), }, style: {fill: cubeLeftStyle, },},{ type: "CubeRight", shape: {api,xValue: api.value(0),yValue: api.value(1),x: location[0],y: location[1],xAxisPoint: api.coord([api.value(0), 0]), }, style: {fill: cubeRightStyle, },},{ type: "CubeTop", shape: {api,xValue: api.value(0),yValue: api.value(1),x: location[0],y: location[1],xAxisPoint: api.coord([api.value(0), 0]), }, style: {fill: cubeTopStyle, },}, ],}; }, data: VALUE,},{ type: "bar", label: {show: true,position: "top",fontSize: 14,color: props.color[0],offset: [2, -10], }, itemStyle: {color: "transparent", }, tooltip: {}, data: VALUE,}, ]; const title = mergeConfig({ text: "", textStyle: {color: props.color[0],fontWeight: "800",fontSize: 12, }, left: "18px", top: "1%",},props.title, ); const XAxisLine = mergeConfig({ show: false, lineStyle: {type: "solid",width: 1,color: "#2c3954", },},props.XAxisLine, ); const YAxisLine = mergeConfig({ show: false, lineStyle: {show: true,lineStyle: { type: "solid", width: 1,}, },},props.YAxisLine, ); const legend = mergeConfig({ show: true, left: "center", top: "95%", icon: "circle", textStyle: {color: "#fff", },},props.legend, ); const grid = mergeConfig({ left: "5%", right: "5%", top: "12%", bottom: "0%", containLabel: true,},props.grid, ); const XSplitLine = mergeConfig({ show: false, lineStyle: {type: "dashed",width: 1, },},props.XSplitLine, ); // 纵坐标分割线配置 const YSplitLine = mergeConfig({ // 是否显示 // show: false, show: true, // 样式 lineStyle: {color: "#13263e",type: "solid",width: 1, },},props.YSplitLine, ); const XAxisTick = mergeConfig({ show: false, length: 5, inside: true, alignWithLabel: true, lineStyle: {type: "solid",width: 1, },},props.XAxisTick, ); const YAxisTick = mergeConfig({ show: true, length: 5, inside: true, alignWithLabel: true, lineStyle: {color: "#13263e",type: "solid",width: 1, },},props.YAxisTick, ); let option: echarts.EChartsCoreOption = {title,tooltip: { show: false, // 指示器提示的坐标轴 trigger: "axis", // 阴影提示器 axisPointer: {type: "shadow",shadowStyle: { shadowColor: "#2e3e51", // 设置阴影的颜色}, }, formatter: function (params: any) {const item = params[1];return item.name + " : " + item.value; }, // 提示框背景颜色 backgroundColor: "#122843", // 提示框边框颜色 borderColor: "#42D1F1", // 提示框文本样式 textStyle: {color: "#fff", },},legend: legend,grid: grid,xAxis: { type: "category", // boundaryGap: false, data: props.xAxisData, axisLine: XAxisLine, splitLine: XSplitLine, axisTick: XAxisTick, axisLabel: {//x轴文字的配置show: true,color: "#fff",fontSize: 12,rotate: 30, },},yAxis: { type: "value", name: props.yUnit, nameTextStyle: {color: "#fff",fontSize: 16, }, axisLine: YAxisLine, splitLine: YSplitLine, axisTick: YAxisTick, axisLabel: {//y轴文字的配置color: "#fff",fontSize: 12, },},series, }; option = Object.assign(option, props.config); return option;}const props = defineProps({ pid: {type: String,required: true, }, title: {type: Object,default: {}, }, xAxisData: {type: Array,required: true, }, legend: {type: Object,default: {}, }, grid: {type: Object,default: {}, }, XAxisLine: {type: Object,default: {}, }, YAxisLine: {type: Object,default: {}, }, yUnit: {type: String,default: "", }, XSplitLine: {type: Object,default: {}, }, YSplitLine: {type: Object,default: {}, }, XAxisTick: {type: Object,default: {}, }, YAxisTick: {type: Object,default: {}, }, config: {type: Object as () => echarts.EChartsCoreOption,default: {}, }, value: {type: Array,required: true, }, // 柱子的颜色 color: {type: Array,default: ["rgba(29, 230, 235,1)", "rgba(7, 235, 251,1)"], },});let option = initOption();let container: HTMLElement | null = null;let myChart: echarts.ECharts | null = null;const renderChart = (notMerge: boolean = false) => { if (!myChart) myChart = echarts.init(container as HTMLElement); myChart.setOption(option, {notMerge, });};nextTick(() => { container = document.querySelector("#" + props.pid) as HTMLElement; renderChart(); useResizeChart(container, myChart as echarts.ECharts);});watch( () => props, (newVal, oldVal) => {let notMerge = true;option = initOption();renderChart(notMerge); }, {deep: true, },);function exportImg() { const src = (myChart as echarts.ECharts).getDataURL({pixelRatio: 2,backgroundColor: "#08172A", }); const a = document.createElement("a"); a.href = src; a.download = (option.title as { text: string }).text || "chart-img"; a.click();}defineExpose({ exportImg,});</script><style lang="scss" scoped></style>方式2: 象型柱图(type: “pictorialBar”)
echarts象型柱图的官网配置项点这里, 参考的案例在这里, 象型柱图可以单柱可以双柱
封装成组件的完整代码如下:
<template></template><script setup lang="ts">import { nextTick, watch } from "vue";import echarts from "@/assets/ts/echarts";import { LegendComponent } from "echarts/components";echarts.use([LegendComponent]);// 合并配置方法function mergeConfig(defaultConfig: object, config: object) { return Object.assign(defaultConfig, config);}function initOption(): echarts.EChartsCoreOption { // 此时 使用组件只需要要将 zzx1的数据和 wgx1 的数据传递到子组件 // 第一个柱子的值 const zzx1 = props.series[0].data; // 实际值 // 第二个柱子的值 const wgx1 = props.series[1].data; // 变量: 改变每个柱子的大小, 后期可将其设置为动态的? const barWidth = 30; const series = [ // (0)第一个柱子 中间的正方形 { type: "pictorialBar", // 象型柱状 symbol: "diamond", symbolSize: [barWidth, 5], // 调整大小 // symbolOffset: [-13, -3], // 图形相对于原本位置的偏移 symbolOffset: ["-55%", -3], // 图形相对于原本位置的偏移 symbolPosition: "end", z: 12, color: "#2584e0", data: zzx1, }, // (1)第二个柱子中间的正方形 { type: "pictorialBar", symbol: "diamond", symbolSize: [barWidth, 8], // symbolOffset: [13, -3], symbolOffset: ["55%", -3], symbolPosition: "end", z: 12, color: "#07fdd3", data: wgx1, }, // (2)第一个柱子 底部的正方形 { type: "pictorialBar", symbol: "diamond", symbolSize: [barWidth, 5], // symbolOffset: [-13, 3], symbolOffset: ["-55%", 3], z: 12, color: "#355ba8", data: zzx1, }, // (3)第二个柱子 底部的正方形 { name: "", type: "pictorialBar", symbol: "diamond", symbolSize: [barWidth, 5], // symbolOffset: [13, 3], symbolOffset: ["55%", 3], color: "#2095a3", z: 12, data: wgx1, }, // (4)一个柱子, 下方有颜色填充的的柱子 { name: props.nameOne, type: "bar", barWidth: barWidth, barGap: "10%", // zlevel: 2, stack: "1", itemStyle: {opacity: 0.7,color: new echarts.graphic.LinearGradient(0, 0, 1, 0, [ { offset: 0.5, color: "rgba(44, 97, 188,0.7)", // color: "#2c61bc", }, { offset: 0.5, color: "#2584e0", }, { offset: 1, color: "#214a87", },]),// barBorderRadius: 0,borderRadius: 0, }, // 是否在每个柱子显示 相应的值 label: {show: true,position: ["0", "-25"],color: "#005dd9",fontSize: 14,fontWeight:"bold" }, data: zzx1, }, // (5)第二个柱子, 下方有颜色填充的的柱子 { name: props.nameTow, type: "bar", stack: "2", barWidth: barWidth, itemStyle: {opacity: 0.7,color: new echarts.graphic.LinearGradient(0, 0, 1, 0, [ { offset: 0.5, color: "rgba(15, 182, 182,0.7)", }, { offset: 0.5, color: "#0ccec7", }, { offset: 1, color: "#0bddd0", },]),// barBorderRadius: 0,borderRadius: 0, }, // 是否在每个柱子显示 相应的值 label: {show: true,position: ["0", "-25"],color: "#06e6f6",fontSize: 14,fontWeight:"bold" }, data: wgx1, }, ]; // title 配置 const title = mergeConfig( { // 是否显示 show: true, // title 文本 text: "", top: 0, left: "left", // 文字样式 textStyle: {color: "#fff",fontSize: 16, }, }, props.title ); // 横坐标轴线配置 const XAxisLine = mergeConfig( { // 是否显示 show: true, // show: false, // 样式 lineStyle: {// color: "rgba(46, 60, 87)",type: "solid",width: 1, }, }, props.XAxisLine ); // 纵坐标轴线配置 const YAxisLine = mergeConfig( { // 是否显示 // show: true, show: false, // 样式 lineStyle: {// 是否显示show: true,// 样式lineStyle: { color: "#fff", type: "solid", width: 1,}, }, }, props.YAxisLine ); // 横坐标分割线配置 const XSplitLine = mergeConfig( { // 是否显示 show: false, // 样式 lineStyle: {color: "#fff",type: "dotted",width: 1, }, }, props.XSplitLine ); // 纵坐标分割线配置 const YSplitLine = mergeConfig( { // 是否显示 show: true, // 样式 lineStyle: {color: "rgba(46, 59, 86)",type: "dashed",// type: "solid",width: 1, }, }, props.YSplitLine ); // 横坐标刻度配置 const XAxisTick = mergeConfig( { // 是否显示 show: false, // 刻度长度 length: 5, // 是否朝内 inside: true, // 刻度是否居中 alignWithLabel: true, // 样式 lineStyle: {color: "#fff",type: "solid",width: 1, }, }, props.XAxisTick ); // 纵坐标刻度配置 const YAxisTick = mergeConfig( { // 是否显示 show: false, // 刻度长度 length: 5, // 是否朝内 inside: true, // 刻度是否居中 alignWithLabel: true, color: "#fff", // 样式 lineStyle: {color: "#fff",type: "solid",width: 1, }, }, props.YAxisTick ); // 图例标记配置 const legend = mergeConfig( { show: true, right: "0", top: "0", icon: "rect", itemHeight: 10, itemWidth: 10, textStyle: {color: "#fff", }, // 取消默认点击事件 selectedMode: false, // 距离 itemGap: 50, }, props.legend ); // 指示器: const tooltip = { show: false, trigger: "axis", axisPointer: { type: "shadow", }, formatter: function (e: any) { // console.log(e); var str =e[4].axisValue +"<br>" +"<span style="display:inline-block;margin-right:5px;border-radius:10px;width:10px;height:10px;background-color:" +e[4].color.colorStops[0].color +";"></span>" +"" +e[4].seriesName +" : " +e[4].value +"<br>" +"<span style="display:inline-block;margin-right:5px;border-radius:10px;width:10px;height:10px;background-color:" +e[5].color.colorStops[0].color +";"></span>" +"" +e[5].seriesName +" : " +e[5].value; return str; }, // 提示框背景颜色 backgroundColor: "#122843", // 提示框边框颜色 borderColor: "#42D1F1", // 提示框文本样式 textStyle: { color: "#fff", }, }; // 汇总配置 let option: echarts.EChartsCoreOption = { title, tooltip, legend, grid: { top: "12%", left: "2%", right: "2%", bottom: "5%", // height: "85%", containLabel: true, }, xAxis: { type: "category", boundaryGap: true, data: props.xAxisData, axisLine: XAxisLine, splitLine: XSplitLine, axisTick: XAxisTick, axisLabel: {// textStyle: {color: "#fff",fontSize:16// }, }, }, yAxis: { type: "value", // 单位 name: props.yUnit, axisLine: YAxisLine, splitLine: YSplitLine, axisTick: YAxisTick, axisLabel: {// textStyle: {color: "#fff",fontSize:16// }, }, min: 0, // max: props.max, }, series, }; // 合并配置生成最终配置 option = Object.assign(option, props.config); return option;}// propsconst props = defineProps({ // 父容器ID pid: { type: String, required: true, }, title: { type: Object, default: {}, }, // 数据 series: { // type: Array as () => Array<BarSeriesOption>, type: Array as () => { data: number[] }[], required: true, }, // 横坐标 xAxisData: { type: Array, required: true, }, // 图例标记 legend: { type: Object, default: {}, }, // 横坐标轴线 XAxisLine: { type: Object, default: {}, }, // 纵坐标轴线 YAxisLine: { type: Object, default: {}, }, // y轴单位 yUnit: { type: String, default: "", }, // 横坐标分割线 XSplitLine: { type: Object, default: {}, }, // 纵坐标分割线 YSplitLine: { type: Object, default: {}, }, // 横坐标刻度 XAxisTick: { type: Object, default: {}, }, // 纵坐标刻度 YAxisTick: { type: Object, default: {}, }, // 总配置,将与默认配置与用户传入的配置合并 config: { type: Object as () => echarts.EChartsCoreOption, default: {}, }, // 最值 // max: { // type: Number, // // requird: true, // default: 5000, // }, nameOne: { type: String, default: "昨日总量", }, nameTow: { type: String, default: "今日总量", },});// optionlet option = initOption();// chart 容器let container: HTMLElement | null = null;// chart 实例let myChart: echarts.ECharts | null = null;// 渲染方法const renderChart = () => { if (!myChart) myChart = echarts.init(container as HTMLElement); myChart.setOption(option);};// DOM加载后渲染 chartnextTick(() => { // 获取容器 container = document.querySelector("#" + props.pid) as HTMLElement; // 渲染 chart renderChart(); // 自适应 chart // useResizeChart(container, myChart as echarts.ECharts);});// 监听 props 变化watch( () => props, () => { // 更新 option option = initOption(); // 重新渲染chart renderChart(); }, { deep: true, });// 导出为图片function exportImg() { // 生成 base64 图片 const src = (myChart as echarts.ECharts).getDataURL({ pixelRatio: 2, backgroundColor: "#08172A", }); // 下载 const a = document.createElement("a"); a.href = src; a.download = (option.title as { text: string }).text || "chart-img"; a.click();}// 暴露出 chart 图片导出方法,父组件可以通过实例调用defineExpose({ exportImg,});</script><style lang="scss" scoped></style>总结
到此这篇关于echarts实现3d柱状图的2种方式举例的文章就介绍到这了,更多相关echarts实现3d柱状图内容请搜索以前的文章或继续浏览下面的相关文章希望大家以后多多支持!
标签:
JavaScript
相关文章:
排行榜
 网公网安备
网公网安备