基于Django快速集成Echarts代码示例
1.在线定制下载echarts
https://echarts.apache.org/zh/builder.html
2.创建一个django项目或者在已有的项目
配置文件中确保数据库配置、static配置、与添加项目名到INSTALLED_APPS下。 配置静态文件目录static,目录下创建:css、img、js。 保存echarts.min.js到js目录下。 创建templates文件,html文件放到此目录。快速静态测试
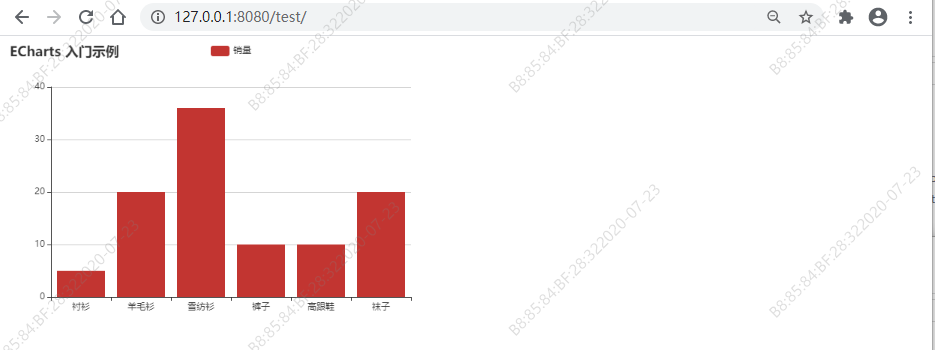
test.html文件
<!DOCTYPE html><html><head> <meta charset='utf-8'> <title>ECharts</title> <!-- 引入 echarts.js --> {% load static %} <script src='https://www.haobala.com/bcjs/{% static ’/js/echarts.min.js’ %}'></script></head><body> <!-- 为ECharts准备一个具备大小(宽高)的Dom --> <div style='width: 600px;height:400px;'></div> <script type='text/javascript'> // 基于准备好的dom,初始化echarts实例 var myChart = echarts.init(document.getElementById(’main’)); // 指定图表的配置项和数据 var option = { title: {text: ’ECharts 入门示例’ }, tooltip: {}, legend: {data:[’销量’] }, xAxis: {data: ['衬衫','羊毛衫','雪纺衫','裤子','高跟鞋','袜子'] }, yAxis: {}, series: [{name: ’销量’,type: ’bar’,data: [5, 20, 36, 10, 10, 20] }] }; // 使用刚指定的配置项和数据显示图表。 myChart.setOption(option); </script></body></html>
urls文件
from django.urls import pathfrom app.views import TestViewurlpatterns = [ path(’test/’,TestView.as_view()),]
Views文件
from django.shortcuts import renderfrom rest_framework.views import Viewfrom rest_framework.response import Responseclass TestView(View): def dispatch(self, request, *args, **kwargs): ''' 请求到来之后,都要执行dispatch方法,dispatch方法根据请求方式不同触发 get/post/put等方法 注意:APIView中的dispatch方法有好多好多的功能 ''' return super().dispatch(request, *args, **kwargs) def get(self, request, *args, **kwargs): return render(request, 'test.html') def post(self, request, *args, **kwargs): return Response(’POST请求,响应内容’) def put(self, request, *args, **kwargs): return Response(’PUT请求,响应内容’)Views文件
访问url地址:
django获取数据库中的数据传递给echarts
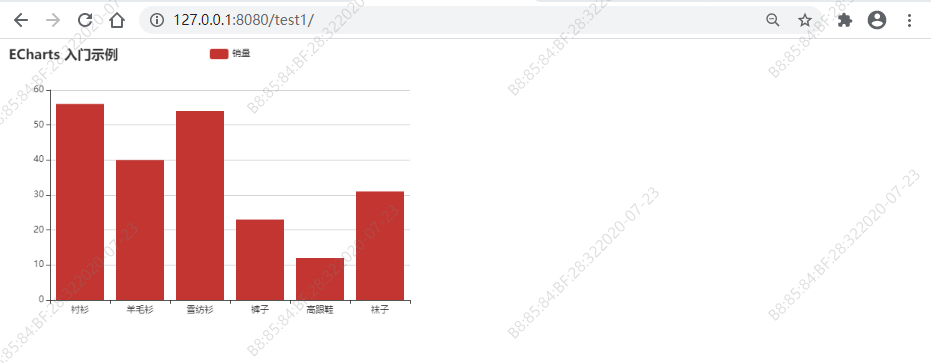
test1.html
<!DOCTYPE html><html><head> <meta charset='utf-8'> <title>ECharts</title> <!-- 引入 echarts.js --> {% load static %} <script src='https://www.haobala.com/bcjs/{% static ’/js/echarts.min.js’ %}'></script></head><body> <div style='width: 600px;height:400px;'></div> <script type='text/javascript'> // 基于准备好的dom,初始化echarts实例 console.log(name) var myChart = echarts.init(document.getElementById(’main’)); // 指定图表的配置项和数据 var option = { title: { text: ’ECharts 入门示例’ }, tooltip: {}, legend: { data: [’销量’] }, xAxis: { data: {{ name|safe }} }, yAxis: {}, series: [{ name: ’销量’, type: ’bar’, data:{{ data|safe }} }] }; // 使用刚指定的配置项和数据显示图表。 myChart.setOption(option); </script></body></html>
urls文件
from django.urls import pathfrom app.views import TestView1urlpatterns = [ path(’test1/’,TestView1.as_view()),]
Views文件
from django.shortcuts import renderfrom rest_framework.views import Viewfrom rest_framework.response import Responseclass TestView1(View): def dispatch(self, request, *args, **kwargs): ''' 请求到来之后,都要执行dispatch方法,dispatch方法根据请求方式不同触发 get/post/put等方法 注意:APIView中的dispatch方法有好多好多的功能 ''' return super().dispatch(request, *args, **kwargs) def get(self, request, *args, **kwargs): name = ['衬衫','羊毛衫','雪纺衫','裤子','高跟鞋','袜子'] data = [56, 40, 54, 23, 12, 31] return render(request, 'test1.html',{'name':name,'data':data}) def post(self, request, *args, **kwargs): return Response(’POST请求,响应内容’) def put(self, request, *args, **kwargs): return Response(’PUT请求,响应内容’)
注意:我在views文件中直接返回数据,在html模板中使用标签渲染,如果你需要使用ORM从数据库拿数据,可以做如下操作:
wheelsList = Wheel.objects.all()name = list(Wheel.objects.values_list(’name’, flat=True))data = list(Wheel.objects.values_list(’trackid’, flat=True))
访问url地址:
echarts异步更新数据
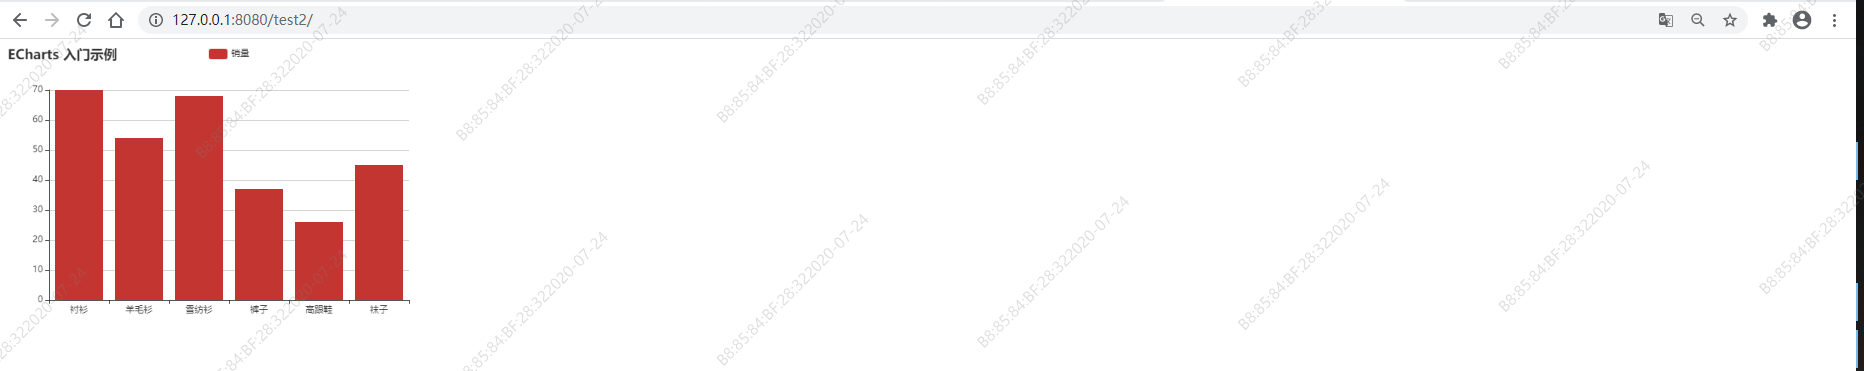
test2.html文件
<!DOCTYPE html><html lang='en'><head> <meta charset='UTF-8'> <title>Title</title> <!-- 引入 jquery.js--> <script src='http://code.jquery.com/jquery-latest.js'></script> <!-- 引入 echarts.js --> {% load static %} <script src='https://www.haobala.com/bcjs/{% static ’/js/echarts.min.js’ %}'></script></head><body> <div style='width: 600px;height:400px;'></div> <script type='text/javascript'> $(function () { var server_info; var myChart = echarts.init(document.getElementById(’main’)); var option = { title: {text: ’ECharts 入门示例’ }, tooltip: {}, legend: {data:[’销量’] }, xAxis: {data: {{ name | safe }} }, yAxis: {}, series: [{name: ’销量’,type: ’bar’,data: {{ data | safe }} }] }; myChart.setOption(option, true); setInterval( function () {$.ajax({ type: ’GET’, url: ’/test1_api/’, dataType: ’json’, success: function (arg) { server_info = eval(arg); option.xAxis.data = server_info.name; option.series[0].data = server_info.data; }}); myChart.setOption(option, true);}, 2000); window.onresize = function () { myChart.resize(); }; }); </script></body></html>
urls文件
from django.urls import pathfrom app.views import TestView,TestView1,TestView1apiurlpatterns = [ path(’test2/’,TestView1.as_view()), path(’test1_api/’,TestView1api.as_view()),]
View文件
from django.shortcuts import renderfrom rest_framework.views import Viewfrom rest_framework.response import Responsefrom django.http import HttpResponseclass TestView1(View): def dispatch(self, request, *args, **kwargs): ''' 请求到来之后,都要执行dispatch方法,dispatch方法根据请求方式不同触发 get/post/put等方法 注意:APIView中的dispatch方法有好多好多的功能 ''' return super().dispatch(request, *args, **kwargs) def get(self, request, *args, **kwargs): name = ['衬衫','羊毛衫','雪纺衫','裤子','高跟鞋','袜子'] data = [56, 40, 54, 23, 12, 31] return render(request, 'test2.html',{'name':name,'data':data}) def post(self, request, *args, **kwargs): return Response(’POST请求,响应内容’) def put(self, request, *args, **kwargs): return Response(’PUT请求,响应内容’)count = 1class TestView1api(View): def dispatch(self, request, *args, **kwargs): ''' 请求到来之后,都要执行dispatch方法,dispatch方法根据请求方式不同触发 get/post/put等方法 注意:APIView中的dispatch方法有好多好多的功能 ''' return super().dispatch(request, *args, **kwargs) def get(self, request, *args, **kwargs): global count name = ['衬衫','羊毛衫','雪纺衫','裤子','高跟鞋','袜子'] data = [56+count, 40+count, 54+count, 23+count, 12+count, 31+count] count = count + 1 print(data) print(count) ret = {’name’: name, ’data’: data} return HttpResponse(json.dumps(ret)) def post(self, request, *args, **kwargs): return Response(’POST请求,响应内容’) def put(self, request, *args, **kwargs): return Response(’PUT请求,响应内容’)
echarts异步加载+异步更新
在上个示例的基础上,修改test2.html如下:
<!DOCTYPE html><html lang='en'><head> <meta charset='UTF-8'> <title>Title</title> <!-- 引入 jquery.js--> <script src='http://code.jquery.com/jquery-latest.js'></script> <!-- 引入 echarts.js --> {% load static %} <script src='https://www.haobala.com/bcjs/{% static ’/js/echarts.min.js’ %}'></script></head><body> <div style='width: 600px;height:400px;'></div> <script type='text/javascript'> $(function () { var server_info; // 基于准备好的dom,初始化ECharts实例 var myChart = echarts.init(document.getElementById(’main’)); // 指定图表的配置项和数据 var option = { title: {text: ’ECharts 入门示例’ }, tooltip: {}, legend: {data: [’销量’] }, xAxis: {data: [] }, yAxis: {}, series: [{name: ’销量’,type: ’bar’,data: [] }] }; myChart.setOption(option, true); // 异步加载json格式数据 $.getJSON(’http://127.0.0.1:8080/test1_api/’, function (data) { myChart.setOption({xAxis: { data: data.name},series: [{ // 根据名字对应到相应的系列 data: data.data}] }); }); // ajax异步更新json格式数据 setInterval( function () {$.ajax({ type: ’GET’, url: ’/test1_api/’, dataType: ’json’, success: function (arg) { server_info = eval(arg); option.xAxis.data = server_info.name; option.series[0].data = server_info.data; }}); myChart.setOption(option, true);}, 2000); window.onresize = function () { myChart.resize(); }; }); </script></body></html>
以上就是本文的全部内容,希望对大家的学习有所帮助,也希望大家多多支持好吧啦网。
相关文章:

 网公网安备
网公网安备