python图像处理基本操作总结(PIL库、Matplotlib及Numpy)
1、读取图片
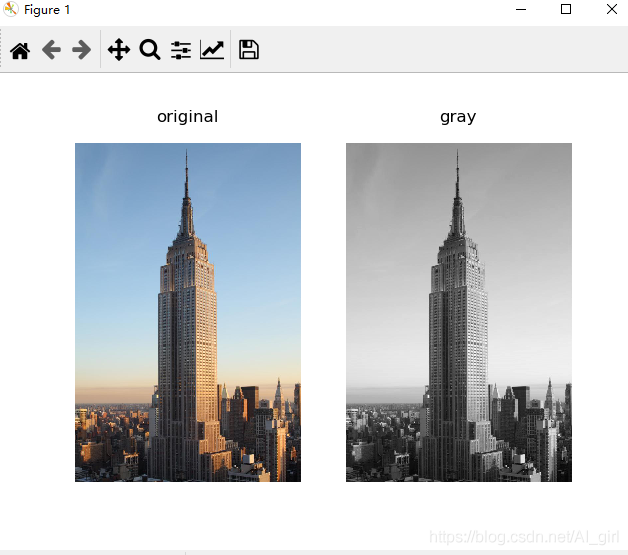
PIL网上有很多介绍,这里不再讲解。直接操作,读取一张图片,将其转换为灰度图像,并打印出来。
from PIL import Imageimport matplotlib.pyplot as pltpil_im = Image.open('empire.jpeg')pil_image = pil_im.convert('L')plt.gray()plt.imshow(pil_image)plt.show()
输出如下所示:
2、转换图片格式
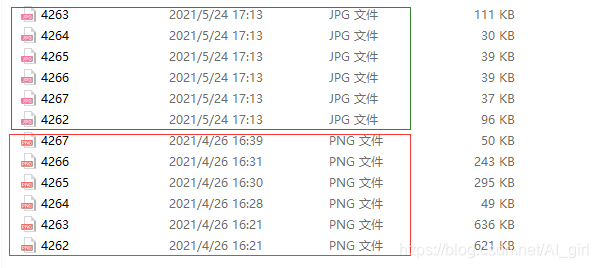
PIL可以将图像保存为多种格式,下面将PNG格式文件保存为JPG格式:
from PIL import Imageimport globimport osfilelist = glob.glob('E:/pythonProject1/filelist/*.png')for infile in filelist: outfile = os.path.splitext(infile)[0]+’.jpg’ if infile != outfile:try: Image.open(infile).save(outfile)except IOError: print('cannot convert', infile)
输出结果如下所示:
3、输出文件夹中所有图片的文件名列表
import osdef get_imlist(path): '''返回目录中所有JPG图像的文件名列表''' return [os.path.join(path,f)for f in os.listdir(path) if f.endswith(’.jpg’)]print(get_imlist('E:/pythonProject1/filelist/'))
输出为文件名列表
二、Matplotlib1、绘制图像、点和线
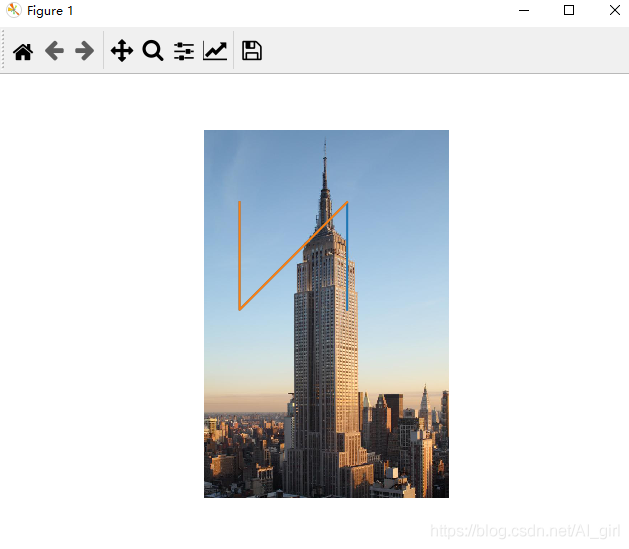
from PIL import Imagefrom pylab import * #读取图像到数组中im = array(Image.open('empire.jpeg')) #绘制图像imshow(im) #一些点x = [100, 100, 400, 400]y = [200, 500, 200, 500] #使用红色星状标记绘制点plot(x, y)#默认为蓝色实线# plot(x, y, ’r*’)#红色星状标记# plot(x, y, ’go-’)#带有圆圈标记的绿线# plot(x, y, ’ks’)#带有正方形标记的黑色虚线 #绘制连接前三个点的线plot(x[:3], y[:3])axis(’off’) #添加标题,显示绘制的图像titles = [’empire’]plt.title = titlesshow()
上面的代码首先绘制出原始图像,然后在 x 和 y 列表中给定点的 x 坐标和 y 坐标上绘制出红色星状标记点,最后在两个列表表示的前两个点之间绘制一条线段。该例子的绘制结果下图:
2、图像轮廓和直方图
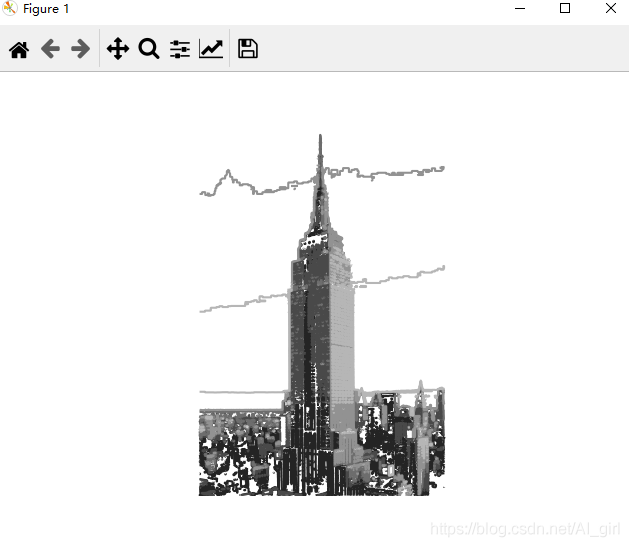
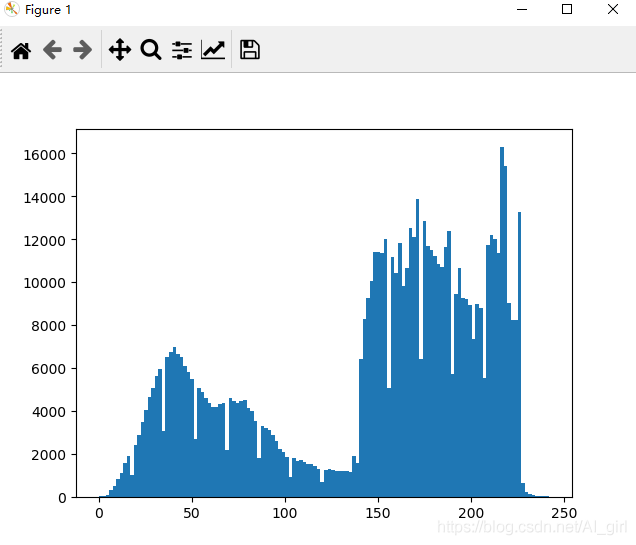
绘制轮廓需要对每个坐标 [x, y] 的像素值施加同一个阈值,所以首先需要将图像灰度化,这里用 PIL 的 convert() 方法将图像转换成灰度图像。图像的直方图用来表征该图像像素值的分布情况。
from PIL import Imagefrom pylab import * # 读取图像到数组中im = array(Image.open('empire.jpeg').convert(’L’)) #创建一个图像figure()#不使用颜色信息gray()#在原点的左上角显示轮廓图像contour(im, origin = ’image’)#检测图像轮廓axis(’equal’)axis(’off’)show()#新建一个图像figurehist(im.flatten(), 128)#绘制图像直方图show()
图像轮廓图输出如下所示:
输出图像直方图如下所示:
3、交互式标注
在一幅图像中标记一些点,或者标注一些训练数据。PyLab 库中的 ginput() 函数就可以实现交互式标注。在图像点击三次,则程序会自动将这3个点的坐标点[x, y]保存到x列表里。
from PIL import Imagefrom pylab import * im = array(Image.open('empire.jpeg'))imshow(im)print('please click 3 points')x = ginput(3)print('you clicked',x)show()三、Numpy
1、图像数组表示
对于图像数据,下面的例子阐述了这一点
from PIL import Imageimport numpy as np im = np.array(Image.open('empire.jpeg'))print(im.shape,im.dtype)
输出为:(1024, 683, 3) uint8
每行的第一个元组表示图像数组的大小(行、列、颜色通道),紧接着的字符串表示数组元素的数据类型。因为图像通常被编码成无符号八位整数(uint8),载入图像并将其转换到数组中,数组的数据类型为“uint8”。
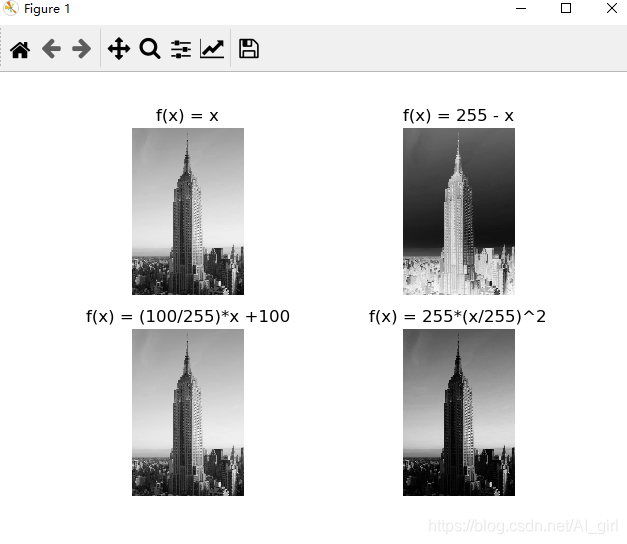
2、灰度变换
对图像进行灰度变换,如下所示:
from PIL import Imageimport numpy as np im = np.array(Image.open('empire.jpeg'))print(im.shape,im.dtype) from PIL import Imagefrom matplotlib.pylab import pltfrom numpy import * im1 = array(Image.open(’empire.jpeg’).convert(’L’))im2 = 255 - im1 #对图像进行反向处理im3 = (100.0/255) * im1 + 100 #将图像值变换到100-200之间im4 = 255.0 * (im1/255) ** 2 #对图像像素值求平方后得到的图像 images = [im1, im2, im3, im4]titles = ['f(x) = x', 'f(x) = 255 - x', 'f(x) = (100/255)*x +100', 'f(x) = 255*(x/255)^2']#输出图中的最大像素值和最小像素值print(int(im1.min()),int(im1.max()))print(int(im2.min()),int(im2.max()))print(int(im3.min()),int(im3.max()))print(int(im4.min()),int(im4.max())) for i in range(4): plt.subplot(2, 2, i+1)#2行2列,按编号顺序排列 plt.imshow(images[i])#显示图像 plt.title(titles[i])#显示标题 plt.gray() # plt.xticks([]) # plt.yticks([]) plt.axis(’equal’) plt.axis(’off’)plt.show()
输出接入如下所示:
到此这篇关于python图像处理基本操作的文章就介绍到这了,更多相关python图像处理操作内容请搜索好吧啦网以前的文章或继续浏览下面的相关文章希望大家以后多多支持好吧啦网!
相关文章:

 网公网安备
网公网安备