快速通过zabbix获取数据库连接的信息及部分扩展
背景
随着应用系统的不断增加,原本不告警的active threads,开始频繁告警(一天2次左右)。虽然告警次数不多,而且该监控项舍得阈值不高(不超过50),但对于运维来说数据库的threads-running是一个必须要重视的点。
一般告警出现在半夜,不可能靠人工去记录threads-running过线后,到底哪些连接正在处理。市面上也没好的工具能自动记录这些数据,所以这时候就需要zabbix的action功能了。
zabbix配置
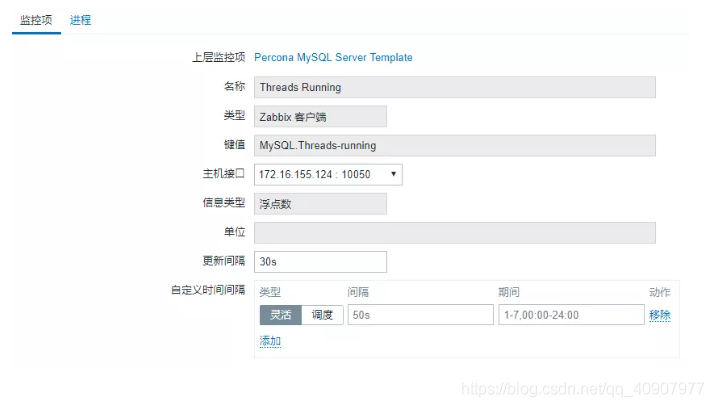
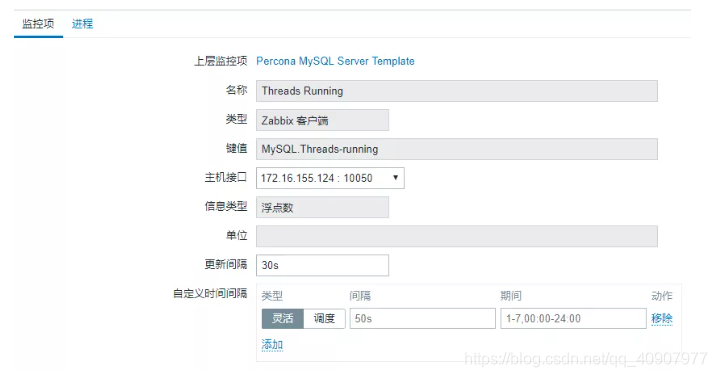
1. 定义监控项
这里偷个懒,直接使用了percona模板中Threads Running监控项:
2. 定义触发器
同样适用percona的触发器设置:
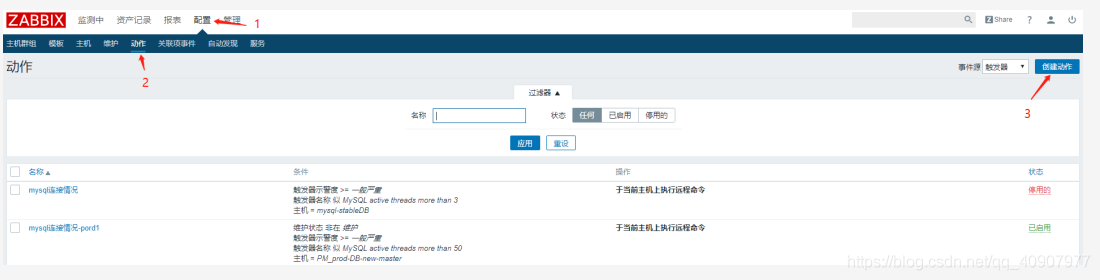
3. 创建action
按照下图的顺序创建action:
4. action条件
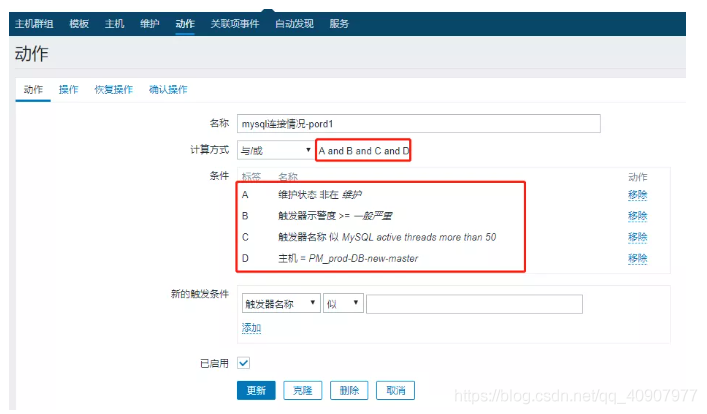
A、B、C、D条件都满足,才会触发动作,这里尽量筛选的详细点,免得出现zabbix错误调用的情况。
5. 完善操作内容
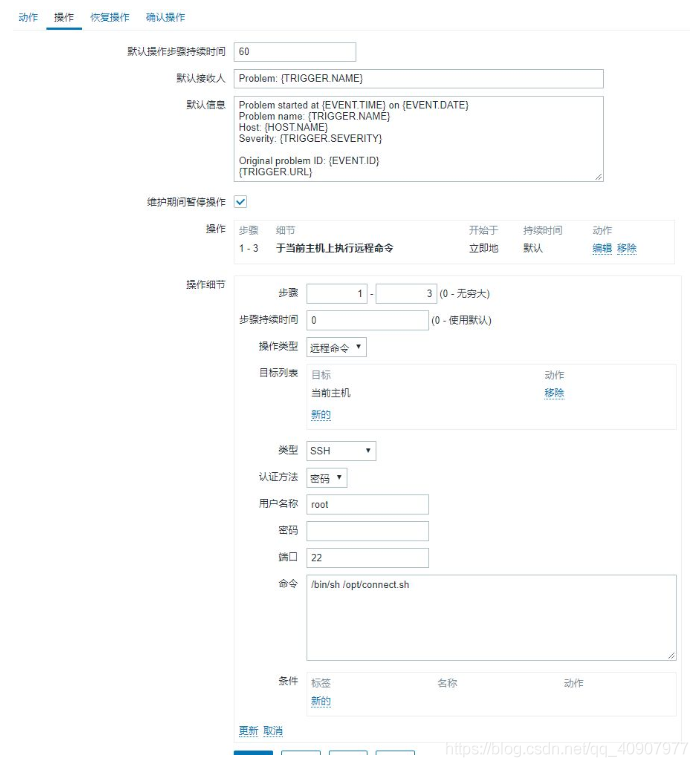
这里适用ssh方式,当然你也可以在类型栏使用自定义脚本选项,就是要多给zabbix客户端赋sudo权限。
命令栏填的是/bin/sh /opt/connect.sh命令,这个很好理解,直接调用connect.sh脚本,具体脚本附在后文中。
6. 修改zabbix-agent配置
进入被监控服务器:
vim /etc/zabbix/zabbix_agentd.conf EnableRemoteCommands=1 #增加这项参数,意思是允许zabbix server远程命令 service zabbix-agent restart
至此,zabbix相关的配置均已完成,接下来只需要将写好的处理脚本放入/opt目录即可。
功能脚本
这次要实现的是,在连接超过50个时,输出到底是哪个账号、哪个ip、在执行哪个sql等信息。脚本如下:
#!/bin/sh export PATH=$PATH:/usr/bin da=`date +%Y%m%d` dc=`date +%Y-%m-%d" "%H:%M:%S` echo $dc"-------------------------------我是分割线------------------------------------" >> /tmp/ok_$da.log /usr/local/mysql/bin/mysql -uroot -pXXX -e "select * from information_schema.PROCESSLIST where COMMAND != "Sleep" order by TIME DESC;" >> /tmp/ok_$da.log
扩展
既然zabbix在报警时可以调用脚本,那是不是可以让zabbix处理点更为复杂的工作?
数据库连接、锁、存储引擎等信息
#!/bin/shexport PATH=$PATH:/usr/binda=`date +%Y%m%d`dc=`date +%Y-%m-%d" "%H:%M:%S`echo $dc"-------------------------------我是分割线------------------------------------" >> /home/zabbix/engine_log/engine_log_$da.log/usr/bin/mysql -hlocalhost -uroot -pXXX -e "show engine innodb status \G;" >> /home/zabbix/engine_log/engine_log_$da.logecho -e "\n\n\n" >> /home/zabbix/engine_log/engine_log_$da.logecho $dc"-------------------------------我是分割线------------------------------------" >> /home/zabbix/processlist/processlist_$da.log/usr/bin/mysql -hlocalhost -uroot -pXXX -e "select * from information_schema.processlist where time>=0 and command !="sleep" order by time desc \G;" >> /home/zabbix/processlist/processlist_$da.logecho -e "\n\n\n" >> /home/zabbix/processlist/processlist_$da.logecho $dc"-------------------------------我是分割线------------------------------------" >> /home/zabbix/lock/lock_$da.log/usr/bin/mysql -hlocalhost -uroot -pXXX -e "select "Blocker" role, p.id, p.user, left(p.host, locate(":", p.host) - 1) host, tx.trx_id, tx.trx_state, tx.trx_started, timestampdiff(second, tx.trx_started, now()) duration, lo.lock_mode, lo.lock_type, lo.lock_table, lo.lock_index, tx.trx_query, tx.trx_tables_in_use, tx.trx_tables_locked, tx.trx_rows_locked from information_schema.innodb_trx tx, information_schema.innodb_lock_waits lw, information_schema.innodb_locks lo, information_schema.processlist p where lw.blocking_trx_id = tx.trx_id and p.id = tx.trx_mysql_thread_id and lo.lock_trx_id = tx.trx_id union all select "Blockee" role, p.id, p.user, left(p.host, locate(":", p.host) - 1) host, tx.trx_id, tx.trx_state, tx.trx_started, timestampdiff(second, tx.trx_started, now()) duration, lo.lock_mode, lo.lock_type, lo.lock_table, lo.lock_index, tx.trx_query, tx.trx_tables_in_use, tx.trx_tables_locked, tx.trx_rows_locked from information_schema.innodb_trx tx, information_schema.innodb_lock_waits lw, information_schema.innodb_locks lo, information_schema.processlist p where lw.requesting_trx_id = tx.trx_id and p.id = tx.trx_mysql_thread_id and lo.lock_trx_id = tx.trx_id \G;" >> /home/zabbix/lock/lock_$da.logecho -e "\n\n\n" >> /home/zabbix/lock/lock_$da.logval=`/usr/bin/mysql -hlocalhost -uroot -pXXX -N -e "show variables like "general_log"" |awk "{print $2}"`if [ $val = "OFF" ];then/usr/bin/mysql -hlocalhost -uroot -pXXX -e "set global general_log=0;"elseexit 0;fi在数据库压力大的时候,可以记录哥哥锁信息、连接信息还有存储引擎信息。所谓压力大,我们可以将触发项定以下几个:
- threads-running:running的连接过多
- Innodb Row Lock Waits:锁等待时间过长
- Com Select\Update\Insert\Delete:增产查改过多
- Incoming\Outgoing network traffic:进出流量不正常时
这些都可以作为触发条件。
杀死长sql
#!/bin/shexport PATH=$PATH:/usr/binda=`date +%Y%m%d`dc=`date +%Y-%m-%d" "%H:%M:%S`user="root"password="XXX"val=`mysql -u$user -p$password -N -e "select count(*) from information_schema.processlist where time>=180 and command ="Query" and user in ("job_name","report")" | awk "{print $1}"`if [ $val -gt 0 ];thenecho $dc"-------------------------------我是分割线------------------------------------" >> /home/zabbix/kill_log/long_query_$da.logmysql -u$user -p$password -e "select * from information_schema.processlist where time>=180 and command ="Query" and user in ("job_name","report") order by time desc \G;" >> /home/zabbix/kill_log/long_query_$da.logecho -e "\n\n\n" >> /home/zabbix/kill_log/long_query_$da.logcount=`mysql -u$user -p$password -N -e "select id from information_schema.processlist where time>=180 and command ="Query" and user in ("job_name","report")"`for id in $count;do mysql -u$user -p$password -e "kill $id"doneelseexit 0;fi有时候一些job或者报表sql会长时间在那里执行,导致影响到其他业务,我们可以简单做下判断,当数据库连接激增,多数是由于有大sql夯在那里,这时候可以让zabbix调用这个脚本去杀死特殊账号发起的超过180秒的sql。至于kill sql的条件可以在脚本中自定义。
当然了,像这种明知需要很长时间才能处理完的sql,应该放在从库中去执行。
删除无用日志
#!/bin/shlogdir="/mysql/logs"binlog="/mysql/binlog"var_percent=`df -h |grep var|grep dev/sda|awk "{print $5}"|awk -F% "{print $1}"`if [ -z $var_percent ] || [ $var_percent -lt 90 ];thenecho "never mind"exit 0fidate >>$binlog/del_list.txtlist=`ls -l --time-style="+%Y-%m-%d %H:%M:%S" $binlog/mysql-bin.0?????|awk "{print $6","$7","$8}"`for i in $listdofiletime=`echo $i|awk -F "," "{print $1,$2}"`filetimestamp=`date -d "$filetime" +%s`cur_time=`date +%s`if [ $(($cur_time - $filetimestamp)) -gt $((3*24*3600)) ];thenfilename=`echo $i|awk -F, "{print $3}"`echo "$filename will delete">>$binlog/del_list.txt/bin/rm $filenamefidoneif [ -f $logdir/mysql-slow.log ];thenslow_log_size=`stat $logdir/mysql-slow.log|grep "Size:"|awk -F ":" "{print $2}"|awk "{print $1}"`if [ $slow_log_size -gt $((2*1024*1024*1024)) ];thenecho "$logdir/mysql-slow.log">>$logdir/del_list.txt/bin/rm $logdir/mysql-slow.logfifi有些时候binlog和slowlog没设置自动删除,时间长了会把磁盘空间占满。这时候我们可以关联Free disk space on /mysql监控项,查过阈值后,调用上面的脚本去清理无用的binlog和slowlog。
在有些依赖binlog的情况下,比如主从中断,之后还需要恢复的情况下,需要谨慎使用。
参考链接 :
通过zabbix获取数据库连接的信息及部分扩展 :https://www.jb51.net/article/207412.htm
到此这篇关于通过zabbix获取数据库连接的信息及部分扩展的文章就介绍到这了,更多相关zabbix数据库连接内容请搜索以前的文章或继续浏览下面的相关文章希望大家以后多多支持!

 网公网安备
网公网安备